
Data Interpretation(DI) Questions for Law Entrance Exams : Tips to Solve DI Questions
July 2, 2026
Reader's Digest: Data Interpretation is an important section of every law entrance examination. In law entrance exams, a large number of questions are asked on data interpretation. These data may be related to the cost of living, cricket average, profit of a company, temperature of cities, expenditure in various sectors of a five-year plan, and so on.
Preparing for law entrance exams isn't just about mastering Legal Reasoning or Current Affairs anymore. Exams like CLAT, AILET, SLAT, MH CET Law, and even CUET LLB (where applicable) test your ability to analyze data quickly and accurately. That's where Data Interpretation(DI) Questions for Law Entrance Exams become an important part of your preparation.
The good news? You don't need to be a maths genius to score well in DI. With regular practice and the right approach, this section can become one of your strongest areas.
In this guide, you'll learn everything about Data Interpretation(DI) Questions for Law Entrance Exams—from the types of questions asked to preparation strategies, solved examples, and expert tips to improve your speed and accuracy.
What Are Data Interpretation(DI) Questions for Law Entrance Exams?
Data Interpretation (DI) questions assess your ability to understand and analyze numerical information presented in different formats such as tables, bar graphs, pie charts, line graphs, and caselets.
Instead of testing complicated calculations, these questions evaluate how efficiently you can interpret data and arrive at the correct answer within a limited time.
In law entrance exams, DI is generally included under the Quantitative Techniques section, where candidates are expected to use basic arithmetic concepts to solve practical problems.
Skills Tested in DI Questions
| Skill | Why It Matters |
|---|---|
| Data analysis | Helps identify patterns and trends quickly |
| Percentage calculations | Frequently used in graphs and tables |
| Ratio and proportion | Essential for comparison-based questions |
| Logical thinking | Required to interpret information correctly |
| Speed and accuracy | Crucial in time-bound entrance exams |
Why Should You Practice Data Interpretation(DI) Questions for Law Entrance Exams?
Many students spend most of their preparation time on English and Legal Reasoning while ignoring Quantitative Techniques. However, this section often becomes the deciding factor in close competitions.
Practising Data Interpretation(DI) Questions for Law Entrance Exams helps you:
- Improve calculation speed
- Strengthen analytical thinking
- Increase confidence in Quantitative Techniques
- Reduce silly mistakes
- Score easy marks with consistent practice
Even if mathematics isn't your strongest subject, regular practice can significantly improve your performance.
Which Law Entrance Exams Include Data Interpretation Questions?
Here's a quick overview:
| Exam | DI Questions Included? |
|---|---|
| CLAT UG | ✅ Yes (Quantitative Techniques) |
| AILET | Occasionally |
| SLAT | Yes |
| MH CET Law | Yes |
| CUET LLB (if applicable) | Depends on the pattern |
| State Law Entrance Exams | Often included |
Among these, CLAT gives the highest importance to Data Interpretation under the Quantitative Techniques section.
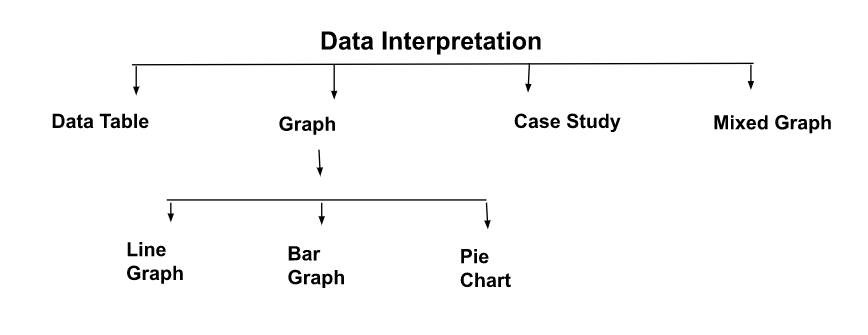
Basics Of Data Interpretation
Data Interpretation questions are divided into 4 parts, i.e., (i) Data Table, (ii) Graph, (iii) Case study, (iv) Mixed Graph.
What Types of Data Interpretation(DI) Questions for Law Entrance Exams Are Asked?
Understanding different question types helps you prepare more effectively.
1. Table-Based DI
Information is presented in rows and columns.
Questions generally involve:
- Comparing values
- Calculating percentages
- Finding averages
- Identifying maximum and minimum values
2. Bar Graph Questions
These questions require candidates to compare values represented by bars.
Commonly tested concepts include:
- Difference
- Growth
- Ratio
- Percentage increase
3. Pie Chart Questions
Pie charts represent data as percentages or proportions.
You may be asked to calculate:
- Sector values
- Percentage contribution
- Difference between categories
4. Line Graph Questions
These measure trends over time.
Students should be comfortable identifying:
- Highest growth
- Decline
- Average increase
- Year-on-year comparison
5. Mixed Graph Questions
Some questions combine two or more graphical representations, making them slightly more challenging.
These are increasingly common in competitive exams.
How Can You Solve Data Interpretation Questions Faster?
The secret isn't solving lengthy calculations—it's solving smartly.
Follow these steps:
Step 1: Read the Question First
Before looking at the graph, quickly read what is being asked.
This helps you focus only on the required information.
Step 2: Understand the Data
Pay attention to:
- Units
- Legends
- Labels
- Years
- Categories
Many mistakes happen because students ignore these details.
Step 3: Use Approximation Whenever Possible
Competitive exams rarely require perfectly accurate decimal calculations.
Approximating values can save precious time.
Step 4: Avoid Recalculating
If you've already calculated a percentage or ratio, note it down.
Recalculating wastes time during the exam.
Data interpretation Question For Law Entrance Exam - Data Table
Data collected in a systematic form in a table is called the tabular arrangement, and this information collection is called a table. Horizontal lines of the table are called rows, and vertical lines of the table are called columns. They have distinct heads called captions units of measurement given with captions.
In these questions, data regarding common disciplines as students applying for a particular specialization, students who passed and failed, production over a few years, imports, exports, and employees' incomes are given in tabular arrangement. Here, the candidate is expected to understand the given information and then answer the questions, followed by a table.
Here, we have to answer the questions directly based on the given information in the table. Here, we do not have to apply mathematical operations to rearrange the information in the table.
These questions are based on simple mathematical operations like addition, subtraction, ratio, percentage, average, etc.
For example:
Study the following table carefully to answer the questions that follow:
Number of Workers Employed in SIx Units of a Factory During the Years
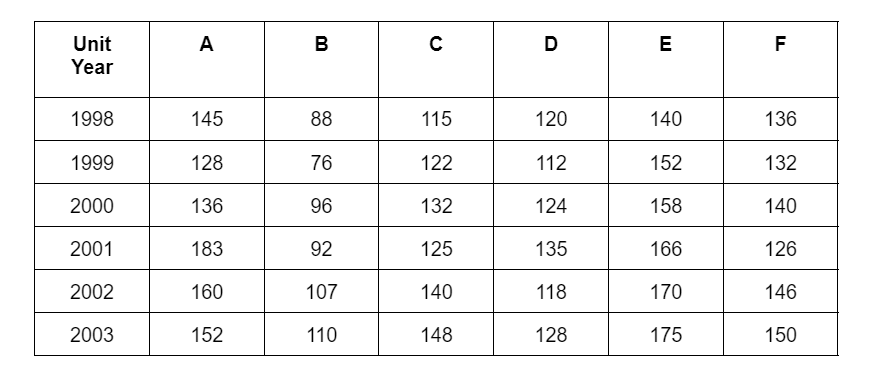
(i). In the year 2000, the number of employed workers by unit C is what percent of the total number of employed workers by all the units in the same year (rounded off to two places of decimal)?
(a). 16.39
(b). 17.21
(c). 16.88
(d). 17.31
(e). None of these
Answer: (e). None of these
Explanation:
Total number of employed workers by all the units in year 2000 ₌ 136 ₊ 96 ₊ 132 ₊ 124 ₊ 158 ₊ 140 ₌ 786
Therefore, the required percentage ₌ 132 / 786 x 100 ₌ 16.79%
(ii). For all the given years, what is the difference between the average number of workers in units D and E?
(a). 37
(b). 33
(c). 33 ⅔
(d). 37 ⅓
(e). None of these
Answer: (d). 37 ⅓
Read more: Short tricks to crack Law Entrance Exams on the first attempt
Explanation:
Total number of workers in unit D ₌ 120 ₊ 112 ₊ 124 ₊ 135 ₊ 118 ₊ 128 ₌ 737
Therefore, the average number of workers in unit D ₌ 737 / 6.
Total number of workers in unit E ₌ 140 ₊ 152 ₊ 158 ₊ 166 ₊ 170 ₊ 175 ₌ 961
Therefore, the average number of workers in unit E ₌ 961 / 6.
hence , the required difference ₌ 961/6 ₋ 737/6 ₌ 224/6 ₌ 37 ⅓ .
(iii). In which year, the percentage increase/ decrease in the number of employed workers is minimum for unit F?
(a). 1999
(b). 2000
(c). 2002
(d). 2003
(e). None of these
Answer: (d). 2003
Explanation:
In year 1999,
136 ₋ 132 / 136 x 100 ₌ 2.94% (Decrease)
In year 2000,
140 ₋ 132 / 132 x 100 ₌ 6.06% (Increase)
In year 2001,
140 ₋ 126 / 140 x 100 ₌ 10% (Decrease)
In year 2002,
146 ₋ 126 / 126 x 100 ₌ 15.87% (Increase)
In year 2003,
150 ₋ 146 / 146 x 100 ₌ 2.74% (Increase)
Hence, it is minimum for the year 2003.
Read more: Data Interpretation questions for CLAT
Important Data Interpretation Questions - Graph
Type 1. Line Graph
In the section on two-dimensional geometry, a point can be shown by using two dimensions 𝓍 and y. 𝓍 is the horizontal direction, while y is the vertical direction. Using these points, we can draw a line graph. A line graph is also known as a cartesian graph. The candidate is required to analyze the given information and thereafter answer the given questions on the basis of the analysis of data.
For Example:
Study the following graph carefully and answer the questions given below:
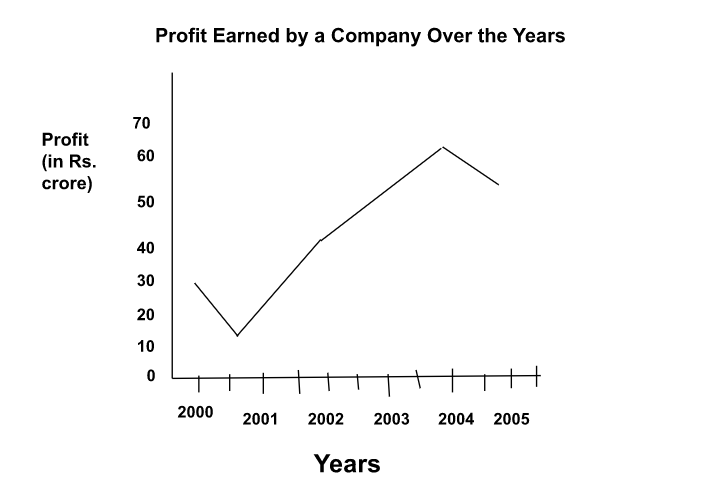
(i). The income of the company in the year 2000 was 750 crore and the income of the company in the year 2003 was 95 crore. What is the respective ratio of the expenditure of the company in the year 2000 to the expenditure of the company in the year 2003?
(a). 5 : 9
(b). 1 : 3
(c). 4 : 7
(d). 4 : 9
(e). None of these
Answer: (d). 4 : 9
Explanation:
⇒ Income of company in year 2000 ₌ Rs.50 crore
⇒ Gain ₌ Rs. 30 crore
⇒ Expenditure ₌ (50-30) ₌ Rs. 20 crore
⇒ Similarly, expenditure of company in year 2003 ₌ (95-50) ₌ Rs. 45 crore
Hence, the required ratio ₌ 20 : 45 ₌ 4 : 9
(ii). What is the approximate percent profit of the year 2004, if the income of the company was 136 crore?
(a). 85
(b). 75
(c). 79
(d). 82
(e). 73
Answer: (c). 79
Explanation:
⇒ Required gain percentage ₌ 60/136 ₋ 60 x100.
⇒ Required gain percentage ₌ 60 / 76 x 100
⇒ Required gain percentage ₌ 79%
(iii). The expenditure of the company in the year 2001 was 45 crore, what was the income of the company in that year?
(a). Rs. 40,00,00,000
(b). Rs. 60,00,00,000
(c). Rs. 55,000,000
(d). Rs. 60,000,000
(e). None of these
Answer: (b). Rs. 60,00,00,000
Explanation:
⇒ Income of company in 2001 ₌ (45+15) ₌ Rs. 60 crore.
(iv). In which year is the percent increase/decrease in profit the highest from that of the previous year?
(a). 2002
(b). 2001
(c). 2003
(d). 2004
(e). None of these
Answer: (a). 2002
Explanation:
It is clear from the graph that the maximum per cent increase is for the year 2002.
(v). What is the average profit earned by the company over the years?
(a). Rs. 4,25,00,000
(b). Rs. 42,00,00,000
(c). Rs. 42,80,00,000
(d). Rs. 43,00,00,000
(e). None of these
Answer: (e). None of these
Read more: Short tricks to study legal reasoning for law entrance exams
Explanation:
⇒ Required average gain ₌ (30 ₊ 15 ₊ 45 ₊ 50 ₊ 60 ₊ 55) ₌ ⅙ x 255 ₌ Rs. 42.5 crore.
Type 2 - Bar Graph
Questions based on bar graphs include the data collected in a particular discipline are represented in the form of vertical or horizontal bars drawn by selecting a particular scale. A bar is a thick line whose width is shown merely for attention. This method of data interpretation is more or less similar to the one in cartesian graphs except that the data plotted on cartesian graphs is continuous whereas in bar graphs the data is discrete. Here, we are given some information based on a bar graph. The candidate is required to understand the given information and thereafter answer the given questions on the basis of data analysis.
For Example:
Study the graph carefully to answer the questions given below:
Number (in thousands) of Hotels in different states
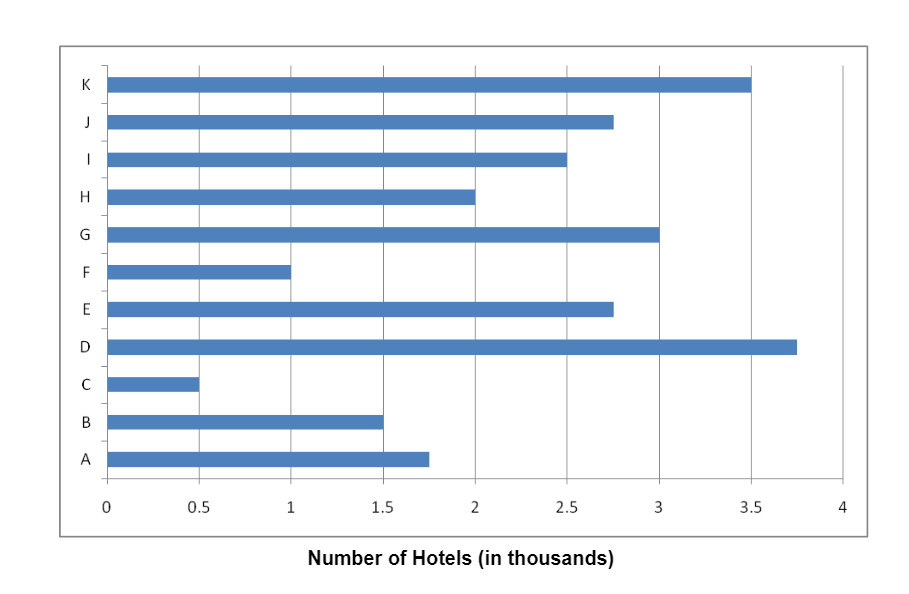
(i). What is the approximate average number of hotels from all the states together?
(a). 2500
(b). 3000
(c). 2200
(d). 2010
(e). 3100
Answer: (c). 2200
Read more: Top Government Law Colleges in India
Explanation:
Average number of hotels ₌ 1 / 11 (1.75 ₊ 1.5 ₊ 0.5 ₊ 3.25 ₊ 2.75 ₊ 1 ₊ 3 ₊ 2 ₊ 2.5 ₊ 2.75 ₊ 3.5) ₌ 24.5/11 thousand ₌ 24.5 x 1000/ 11 ₌ 2200.
(ii). Number of hotels in State A is what percent of the total number of hotels from all the states together?
(a). 15.12
(b). 17.24
(c). 9.36
(d). 11.22
(e). None of these
Answer: (e). None of these
Explanation:
⇒ Number of hotels in State I ₌ 2.5
⇒ Number of hotels in all the states ₌ 24.5
⇒ Hence, required percentage ₌ 2.5/24.5 x 100 ₌ 10.20%
(iii). The respective ratio between the number of hotels in State E to those in State A is 11: 10. How many more hotels in State A would make the ratio between State E and State A 11:13, respectively?
(a). 750
(b). 550
(c). 300
(d). 800
(e). None of these
Answer: (a). 750
Read more: Paper Pattern for CLAT entrance exam
Explanation:
⇒ Number of hotels in State E ₌ 2.75 thousand
⇒ Number of hotels in State l ₌ 2.5 thousand
⇒ Let a hotel be added to State I,
Then, 2.75/25+ a ₌ 11/13 18.
⇒ 2.75 x 13 ₌ 11 x 2.5 ₊ 11 x 2.5 ₊ 11 x a
⇒ 11a ₌ 35.75 ₋ 27.5 ₌ 8.25
⇒ a ₌ 8.25/11 ₌ 0.75 thousand ₌ 750
(iv). Total number of hotels from States B, D and F together form approximately, what percent of the total number of hotels from all states together?
(a). 19
(b). 23
(c). 40
(d). 32
(e). 36
Answer: (b). 23
Explanation:
⇒ Number of hotels from States B, D and F ₌ 1.5 ₊ 3.25 ₊ 1 ₌ 5.75 thousand
⇒ Hence, required percentage ₌ 5.75/24.5 x 100 ₌ 25.51% ₌ 23%
(v). What is the respective ratio of the number of hotels from D, G and C, H, K?
(a). 5 : 2
(b). 4 : 1
(c). 6 : 5
(d). 3 : 4
(e). None of these
Answer: (e). None of these
Explanation:
⇒ Number of hotels from States A, D and G ₌ 1.75 ₊ 3.25 ₊ 3 ₌ 8 thousand
⇒ Number of hotels from States C, H and K ₌ 0.5 ₊ 2 ₊ 3.5 ₌ 6 thousand
⇒ Hence, required ratio ₌ 8 : 6 ₌ 4 : 3.
Read more: Short tricks to study Maths for Law Entrance Exams


Pie Chart Format Data Interpretations Questions for Law Entrance Exam
When two lines are drawn on the surface of a circle, then area covered is called the sector of circle. Many sectors can be drawn in the circle. Each slice section of pie shows the portion of the entire pie allocated to each category.
The sectors of the circle are constructed in such a way that the area of each sector is proportional to the corresponding value of the component of the data. Also, according to geometry, the area of the sector of a circle is proportional to the central angle. Here, data can be plotted with respect to only one parameter.
This method is also useful for representing proportions or percentages of various elements with respect to the total quantity.
As we know that the sum of all the central angles is 360.
hence, the central angle of the component ₌ (Value of the component / Total Value x 360).
For Example:
Study the following pie chart carefully to answer the questions that follow:
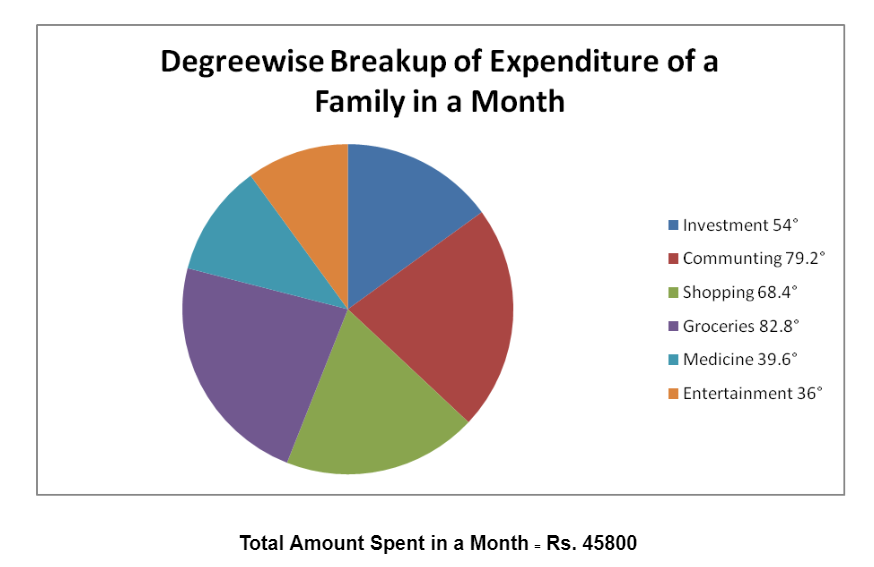
(i). What is the amount spent by the family on commuting?
(a). Rs. 10076
(b). Rs. 10534
(c). Rs. 6870
(d). Rs. 8702
(e). None of these
Answer: (a). Rs. 10076
Explanation:
⇒ The corresponding angle for commuting ₌ 792°
Also, 360 ₌ 45800 (According to the pie chart)
⇒ Hence, 7920° ₌ 792°/360 x 45800 ₌ Rs. 10076
(ii). What is the respective ratio of the amount spent by family on medicine to the amount spent on groceries?
(a). 1 : 2
(b). 13 : 21
(c). 3 : 5
(d). 11 : 23
(e). None of these
Answer: (d). 11 : 23
Explanation:
⇒ Required ratio ₌ 396°: 82.8° ₌ 11 : 23
(iii). What is the total amount spent by the family on entertainment and shopping together?
(a). Rs. 9618
(b). Rs. 13282
(c). Rs. 13740
(d). Rs. 11908
(e). None of these
Answer: (b). Rs. 13282
Explanation:
⇒ Corresponding angle for entertainment and shopping together ₌ 36°₊ 68.4⁰ ₌ 104.4° ⇒ Hence, total amount ₌ 104.4° / 360° x 45800 ₌ Rs. 13282
(iv). Total amount spent by the family on groceries, entertainment and investment together forms approximately, what percent of the amount spent on commuting?
(a). 209
(b). 76
(c). 154
(d). 42
(e). 218
Answer: (e). None of these
Explanation:
⇒ Corresponding total angle for entertainment, groceries, and investment together ₌ 82.8° ₊ 36° ₊ 54° ₌ 172.8°
⇒ Corresponding angle for commuting ₌ 79.2°
Therefore, the required percentage ₌ 172.8°/ 79.2° x 100 ₌ 218%
(v). Amount spent by the family on medicine forms, what percent of the amount spent on shopping? (Rounded off to two digits after decimal).
(a). 43.67
(b). 49.52
(c). 57.89
(d). 61.89
(e). None of these
Answer: (c). 57.89
Explanation:
Required percentage ₌ 39.6° / 68.4° x 100 ₌ 57.89%
Case Study Related Data Interpretation Questions for Law Entrance Exam
Such questions are followed with a paragraph having information in jumbled form. Candidate is required to extract information from the paragraph and then solve the questions.
These paragraphs have applications including percentage and ratio. Some questions can be solved by making a venn diagram and some can be solved using tabular form.
For Example:
Study the following information carefully to answer the questions.
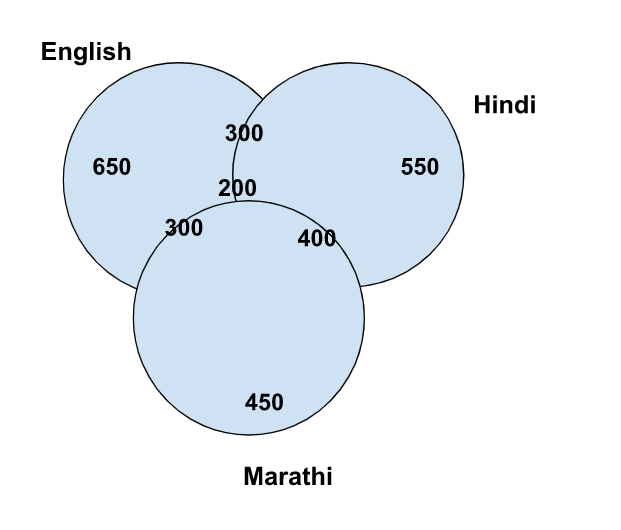
The officer's colony of Badaun has 2800 members. Out of which 650 members read only English newspapers. 550 members read only Hindi newspapers and 450 members read only Marathi newspapers. The number of members reading all three newspapers is 200. 400 members read Hindi as well as Marathi newspapers and 300 members read English as well as Marathi newspapers and 300 members read English as well as Hindi newspapers.
(i) Find the difference between the number of members reading English and Marathi newspapers and the number of members reading English and Hindi newspapers.
(a) 300
(b). 200
(c). 100
(d). 50
(e). None of these
Answer: (e). None of these
Explanation:
⇒ Required Difference ₌ Number of members reading both English and Marathi ₋ Number of members reading both Hindi and English ₌ 300 ₋ 300 ₌ 0
(ii). How many members read at least two newspapers?
(a). 600
(b). 800
(c). 500
(d). 100
(e). None of these
Answer: (e). None of these
Explanation:
⇒ Number of members who read at least two newspaper ₌ 400 ₊ 300 ₊ 300 ₊ 200 ₌ 1200
(iii). Find the number of members reading Hindi newspapers.
(a). 750
(b). 980
(c). 1000
(d). 1020
(e). None of these
Answer: (e). None of these
Explanation:
⇒ Number of members reading Hindi newspaper ₌ 550 ₊ 400 ₊ 300 ₊ 200 ₌ 1450
(iv). How many members read only one newspaper?
(a). 1560
(b). 1650
(c). 1640
(d). 1540
(e). None of these
Answer: (b). 1650
Explanation:
⇒ Number of members who read only one newspaper ₌ 550 ₊ 650 ₊ 450 ₌ 1650
(v). Find the number of members reading at least three newspapers.
(a). 200
(b). 460
(c). 550
(d). 750
(e). None of these
Answer: (a). 200
Explanation:
⇒ Number of members reading at least three newspaper ₌ 200.
Data Interpretation Questions - Mixed Graph
This section comprises questions which data collected in a particular discipline are represented by two or more than two data interpretation graphs. Sometimes, only one form of data representation like bar graphs, table and line graphs is not sufficient to give the true representation of facts.
For example:
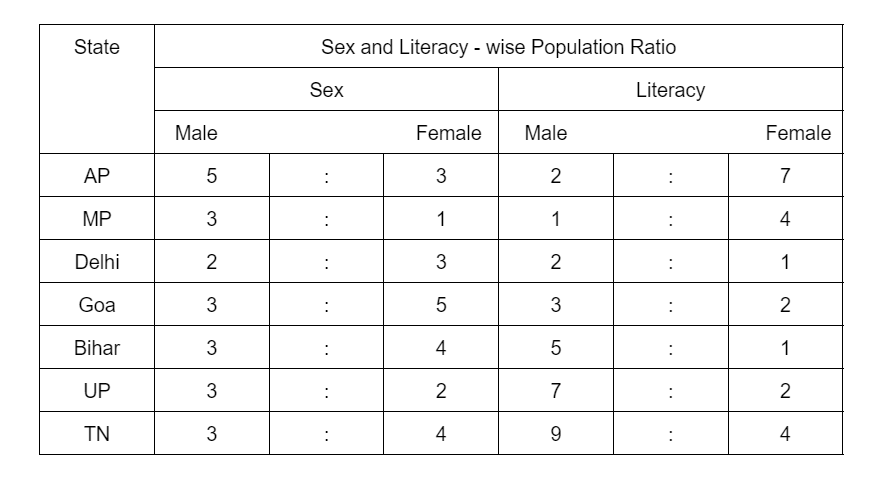
Study the following graph and the table and answer the questions given below.
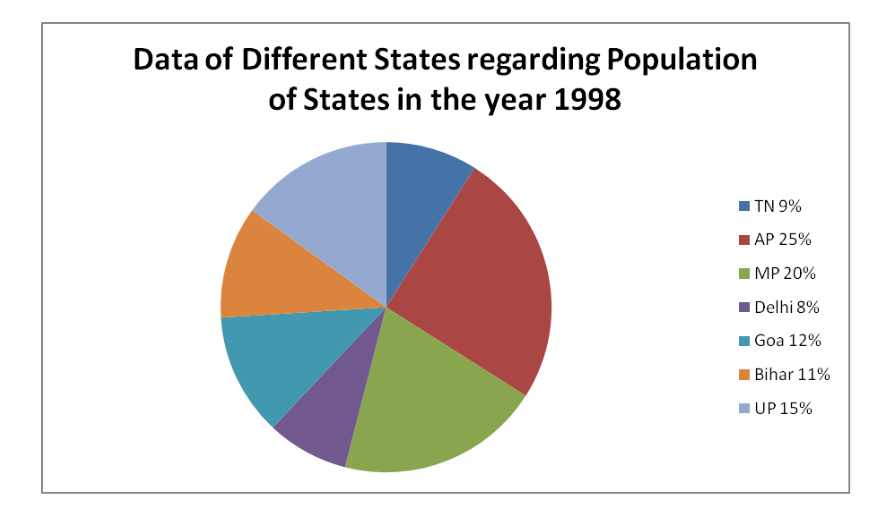
(i). What was the number of males in UP in the year 1998?
(a). 254650
(b). 294840
(c). 321470
(d). 341200
(e). None of these
Answer: (b). 294840
Explanation:
⇒ Total population in UP ₌ 15% of 3276000
⇒ Number of males in UP ₌ ⅗ of (15% of 3276000)
₌ ⅗ x 15/100 x 3276000
₌ 294840
(ii). What was the total number of illiterate people in AP and MP in 1998?
(a). 876040
(b). 932170
(c). 981550
(d). 1161160
(e) None of these
Answer: (d). 1161160
Explanation:
⇒ Number of illiterate people in AP ₌ 7/9 of (25% of 3276000)
₌ 7/9 x 25/100 x 3276000 ₌ 637000
⇒ Number of illiterate people in MP ₌ ⅘ of (20% of 3276000)
₌ ⅘ x 20/100 x 3276000 ₌ 524160
⇒ Total number ₌ 637000 ₊ 524160 ₌ 1161160
(iii). What is the ratio of the number of females in TN to the number of females in Delhi?
(a). 7 : 5
(b). 9 : 7
(c). 13 : 11
(d). 15 : 14
(e). None of these
Answer: (d). 15 : 14
Explanation:
⇒ Number of females in TN ₌ 4/7 of (9% of 3276000)
⇒ Number of females in Delhi ₌ ⅗ of (8% of 3276000)
⇒ Hence, required percentage ₌ 4/7 of (9% of 3276000)/ ⅗ of (8% of 276000)
₌ 168480/157248
₌ 15/14 i.e. 15:14
Read more: Upcoming Law Entrance Exams
(iv). What will be the percentage of total number of males in UP, MP and Goa together to the total population of all the given states?
(a). 25
(b). 27.5
(c). 28.5
(d). 31.5
(e). None of these
Answer: (c). 28.5
Explanation:
State UP,
⇒ UP ₌ ⅗ of (15% of 3276000)
₌ 9 x 3276000/100
₌ 294840
State MP,
⇒ MP ₌ ¾ of (20% of 3276000)
₌ 15 x 3276000/100
₌ 491400
State Goa,
⇒ Goa ₌ ⅜ of (12% of 3276000)
₌ 4.5 x 3276000/100
₌ 147420
⇒ Hence, total number of males in these three states ₌ 294840 ₊ 491400 ₊ 147420
₌ 933660
⇒ Hence, the required percentage ₌ {933660 / 3276000 x 100} ₌ 28.5
Data Interpretation Questions For CLAT
To help you get an idea about the type of questions asked in the exam, we have provided few questions for your reference here. These questions are curated from the Previous Year's CLAT Question Papers.
This article will get all the DI Important questions for the law entrance test.
Question 1: Direction (1 - 5): Given bar graph showing the number of people infected by Covid - 19 in six different states in India. Table is showing the ratio of male and female patients in the given states. Read the given data carefully and answer the following questions.
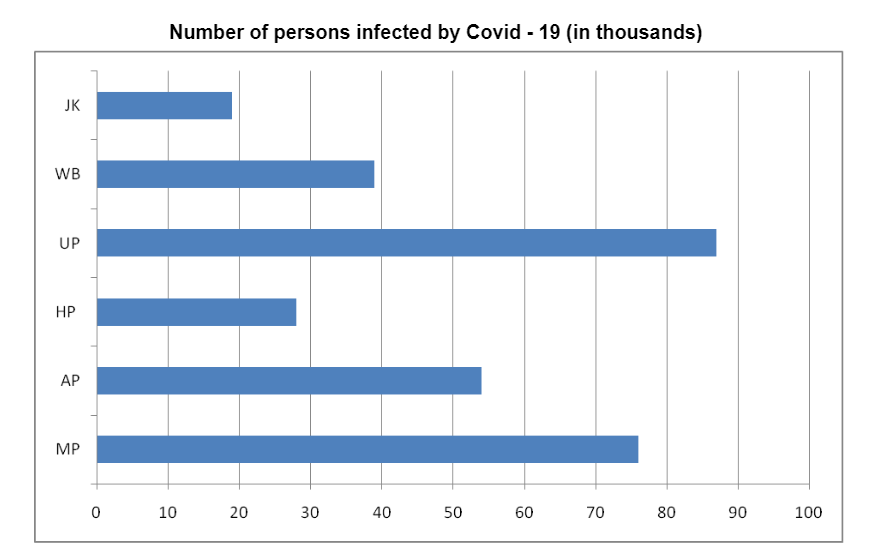
| States | Ratio of Males and Females |
| Male : Female | |
| Madhya Pradesh | 14 : 5 |
| Andhra Pradesh | 6 : 3 |
| Himachal Pradesh | 5 : 2 |
| Uttar Pradesh | 15 : 14 |
| West Bengal | 7 : 6 |
| JharKhand | 11 : 8 |
1. Number of females infected in Madhya Pradesh is how much percentage more or less than the number of males In Jharkhand.
(a). 121.21%
(b). 81.81%
(c). 55%
(d). 44%
Answer: (b). 81.81%
Explanation:
As we have seen in the above bar graph and table, we will need the exact number of male and females in each state to solve the questions easily.
Males and Females in Madhya Pradesh,
⇒ The ratio of males and females in Madhya Pradesh ₌ 14 : 5
⇒ The Total number of persons affected ₌ 76000
⇒ males ₌ 76000 / 19 ₌ 4000
₌ 4000 x 14 ₌ 56000
⇒ females ₌ 76000 / 19 ₌ 4000
₌ 4000 x 5 ₌ 20000
Males and Females in Andhra Pradesh,
⇒ The ratio of males and females in Andhra Pradesh ₌ 6 : 3
⇒ The Total number of persons affected ₌ 54000
⇒ males ₌ 54000 / 9 ₌ 6000
₌ 6000 x 6 ₌ 36000
⇒ females ₌ 54000 / 9 ₌ 6000
₌ 6000 x 3 ₌ 18000
Males and Females in Himachal Pradesh,
⇒ The ratio of males and females in Himachal Pradesh ₌ 5 : 2
⇒ The Total number of persons affected ₌ 28000
⇒ males ₌ 28000 / 7 ₌ 4000
₌ 4000 x 5 ₌ 20000
⇒ females ₌ 28000 / 7 ₌ 4000
₌ 4000 x 2 ₌ 8000
Males and Females in Uttar Pradesh,
⇒ The ratio of males and females in Uttar Pradesh ₌ 15 : 14
⇒ The Total number of persons affected ₌ 87000
⇒ males ₌ 87000 / 29 ₌ 3000
₌ 3000 x 15 ₌ 45000
⇒ females ₌ 87000 / 29 ₌ 3000
₌ 3000 x 14 ₌ 42000
Males and Females in West Bengal,
⇒ The ratio of males and females in West Bengal ₌ 7 : 6
⇒ The Total number of persons affected ₌ 39000
⇒ males ₌ 39000 / 13 ₌ 3000
₌ 3000 x 7 ₌ 21000
⇒ females ₌ 39000 / 13 ₌ 3000
₌ 3000 x 6 ₌ 18000
Males and Females in Jharkhand,
⇒ The ratio of males and females in Jharkhand ₌ 11 : 8
⇒ The Total number of persons affected ₌ 19000
⇒ males ₌ 19000 / 19 ₌ 1000
₌ 1000 x 11 ₌ 11000
⇒ females ₌ 19000 / 19 ₌ 1000
₌ 1000 x 8 ₌ 8000
Now, we will see question 1,
⇒ Number of females infected in Madhya Pradesh ₌ 20000
⇒ Number of males infected in Jharkhand ₌ 11000
⇒ Hence, the required percentage ₌ 9000 /11000 x 100
₌ 9 /11 x 100
₌ 900 /11
₌ 81.81%
2. If the given population is infected due to the non-availability of the vaccine. In all six states, 70% of the population and in Madhya Pradesh 60 % population is vaccinated and non Infected. Then find the ratio of the non-infected population in Madhya Pradesh to all six states.
(a). 76 : 303
(b).19 : 101
(c). 114 : 707
(d). None of these
Answer: (c). 114 : 707
Explanation:
⇒ The total number of persons vaccinated in all six states ₌ 303000 = 30% of infected
⇒ The total number of persons vaccinated in all six states ₌ 303000 /30 x 70
₌ 10100 x 70
₌ 707000
⇒ The total number of persons vaccinated in Madhya Pradesh ₌ 76000 = 40% of infected
₌ 76000 ₊ 38000
₌ 114000
⇒ Hence, the required ratio ₌ of the total number of persons vaccinated in Madhya Pradesh: Total number of persons vaccinated in all the six states
⇒ Ratio ₌ 114000: 707000
⇒ Ratio ₌ 114000: 707000
⇒ Ratio ₌ 114: 707
3. The total number of male populations Infected In Madhya Pradesh, Andhra Pradesh, and Himachal Pradesh is how much more than the total number of female populations Infected In Uttar Pradesh, West Bengal, and Jharkhand.
(a). 112
(b). 69
(c). 181
(d). 44
Answer: (d). 44
Explanation:
⇒ The total number of male populations infected in Madhya Pradesh, Andhra Pradesh, and Himachal Pradesh ₌ 56000 ₊ 36000 ₊ 20000
⇒ The total number of male populations infected in Madhya Pradesh, Andhra Pradesh, and Himachal Pradesh ₌ 112000
⇒ The total number of female populations infected in Uttar Pradesh, West Bengal, and Jharkhand ₌ 42000 ₊ 18000 ₊ 8000
⇒ The total number of female populations infected in Uttar Pradesh, West Bengal, and Jharkhand ₌ 68000
Therefore, the required difference ₌ 112000 - 68000 ₌ 44000
4. If 22.22% of males and 16.66% of females infected population died due to covid - 19 in given six states. Then the dead population is what percent of the surviving population?
(a). 25.20%
(b). 35.30%
(c). 11.11%
(d). 15%
Answer: (a). 25.20%
Explanation:
⇒ The total number of male died in all the six states ₌ 56000 ₊ 36000 ₊ 20000 ₊ 45000 ₊ 21000 ₊ 11000 x 22.22%.
⇒ The total number of male died in all the six states ₌ 189000 x 22.22
⇒ The total number of male died in all the six states ₌ 42000
⇒ The total number of male survived in all the six states ₌ 189000 - 42000 ₌ 147000
⇒ The total number of female died in all the six states ₌ 20000 ₊ 18000 ₊ 8000 ₊ 42000 ₊ 18000 ₊ 8000 x 16.16%.
⇒ The total number of female died in all the six states ₌ 114000 x 16.16
⇒ The total number of female died in all the six states ₌ 19000
⇒ The total number of female survived in all the six states ₌ 114000 - 19000 ₌ 95000
⇒ Total died population ₌ 61000
⇒ Total survived population ₌ 303000 - 61000 ₌ 242000
Hence, the required percentage ₌ 61000 / 242000 x 100
₌ 61 / 242 x 100
₌ 25.20%
5. If these 6 states contribute 15% of India's total Infected population. Then find the total population of India, if 40% of the total population get infected.
(a). 2020000
(b). 5050000
(c). 3030000
(d). CND.
Answer: (b). 5050000
Explanation:
In this question, it is given that the total infected population is only 15% of India’s population.
⇒ The total infected population ₌ 303000 ₌ 15% of India's infected population
So,
⇒ 100% infected ₌ 303000 / 15 x 100
⇒ 100% infected ₌ 2020000
⇒ 40% of the total population get infected ₌ 2020000
⇒ 100% of the total population get infected ₌ 2020000 / 40 x 100
⇒ 100% of the total population get infected ₌ 5050000
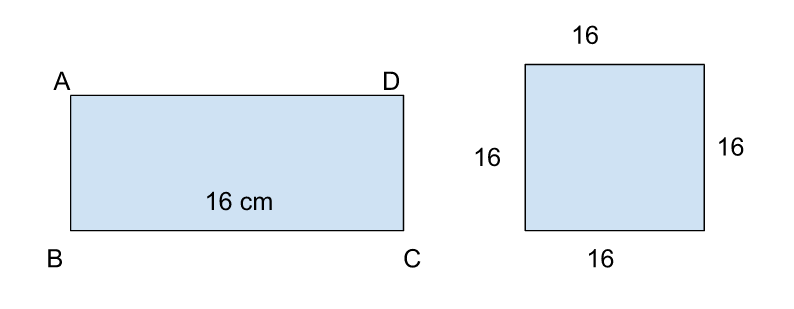
Question 2: Direction (1 - 5). Read the passage carefully and answer the question based on it. We have two fields. One is a rectangle and the other one is square. Length of the rectangular field is 16cm.side of the square field is equal to the length of the rectangle field.
1. Area of the rectangular field is 176 cm³ less than the area of the square field. Find the ratio of Perimeter of given rectangular to square field.
(a). 32 : 21
(b). 4 : 3
(c). 21 : 32
(d). None of these
Answer: (c). 21 : 32
Explanation:
To given: Length of rectangle ₌ 16 cm
Sides of the square ₌ 16 cm
To find: breadth of the rectangle ?
Ratio of perimeter of given rectangle to square field?
Solution:
In the 1st question it is given that:
⇒ Area of Rectangle ₌ Area of square - 176
⇒ L x B ₌ (Side x Side) - 176
⇒ 16 x B ₌ (16 x 16) - 176
⇒ 16 x B ₌ 256 - 176
⇒ 16 x B ₌ 80
⇒ B ₌ 80/16
⇒ B ₌ 5 cm
⇒ Perimeter of Rectangle ₌ 2 (L ₊ B)
⇒ Perimeter of Rectangle ₌ 2 (16 ₊ 5)
⇒ Perimeter of Rectangle ₌ 2 (21)
⇒ Perimeter of Rectangle ₌ 42 cm
⇒ Perimeter of Square ₌ 4 x Side
⇒ Perimeter of Square ₌ 4 x 16
⇒ Perimeter of Square ₌ 64 cm
Therefore, the required ratio ₌ 42 / 64
⇒ The required ratio ₌ 21 : 32
2. If a cow is tied with a rope of length 4 cm at the corner of rectangular field and a goat is tied with a rope of length 6 cm at the corner of square field then find sum of the area which is not grazed by the cow and goat of rectangular field and square field resp. (Approx.)
(a). 190 cm²
(b). 295 cm²
(c). 202 cm²
(d). 352 cm².
Answer: (b). 295cm²
Explanation:
To given: cow tied with a Rope of length 4 cm at the corner of rectangle field
Goat tied with a Rope of length 6 cm at the corner of square field
To find: sum of area which is not grazed by the cow and goat of rectangle field and square field ?
Solution:
For Rectangle and square
⇒ Area not grazed by cow and goat ₌ Area of rectangle - Area of sector + Area of Square - Area of sector
⇒ Area not grazed by cow and goat ₌ (L x B - 90 / 360 x ∏r²) + (side x side - ∏r²)
⇒ Area not grazed by cow and goat ₌ 1(6 x 5 - 90 / 360 x ∏ x 4²) - (16² - ∏ x 6²)
⇒ Area not grazed by cow and goat ₌ (80 + 256) - ∏ / 4 (16 + 36)
⇒ Area not grazed by cow and goat ₌ (336) - ∏ / 4 (52)
⇒ Area not grazed by cow and goat ₌ 336 - 39
⇒ Area not grazed by cow and goat ₌ 297 cm² (Approx)
3. If a goat is tied with rope at the centre of square and length of rope is half of the side of square. Approximate what percent of the square field is not grazed by goats.
(a). 75%
(b). 50%
(c). 42.75%
(d). 21%
Answer: (d). 21%
Explanation:
To given: length of the rope is half of the side of the square
To find: approximately what percent of the square field is not grazed by goats?
Solution:
⇒ Total area of square ₌ side x side
⇒ Total area of square ₌ 16 x 16
⇒ Total area of square ₌ 256 cm²
⇒ Total area of grazed field ₌ ∏r²
⇒ Total area of grazed field ₌ 22 / 7 x 8 x 8
⇒ Total area of grazed field ₌ 22 / 7 x 64
⇒ Total area of grazed field ₌ 22 x 9
⇒ Total area of grazed field ₌ 198
⇒ Total area of grazed field ₌ 200 cm² (Approx)
⇒ Total area of not grazed field ₌ Area of square - total area of grazed field
⇒ Total area of not grazed field ₌ 256 - 200
⇒ Total area of not grazed field ₌ 56 cm²
Hence, the required percentage ₌ 56 / 256 x 100
The required percentage ₌ 21.87%
The required percentage ₌ 21% (approx)
4. If the given rectangular field has two roads each 2 cm wide running in the middle of the field. One is parallel to length and other is parallel to width. Find the total cost of graveling the road if the cost of graveling is 60 paise / cm².
(a). 25.2 Rs.
(b). 20 Rs.
(c). 22.8 Rs.
(d). None of these.
Answer: (c). Rs. 22.8
Explanation:
To Find: total cost of graveling the road?
Solution:
⇒ Cost of graveling the road ₌ Area of Road x Cost
⇒ Cost of graveling the road ₌ {(16 x 2) + (5 x 2) - (2 x 2)} x 0.6
⇒ Cost of graveling the road ₌ (32 + 10 - 4) x 0.6
⇒ Cost of graveling the road ₌ 38 x 0.6
⇒ Cost of graveling the road ₌ Rs. 22.8
5. If two arcs are drawn from two opposite corners taken as the centre of the given square and these arcs pass through remaining two corners of the square. Find common areas enclosed by the arcs
(a). 64 ∏
(b). 128 (∏ - 2)
(c). 64 (∏ -1)
(d). None of these.
Answer: (b). 128 (∏ - 2)
Explanation:
To find: common areas enclosed by the arcs?
Solution:
⇒ Area of common area enclosed by the arcs ₌ (Area of arc - Area of triangle) x 2
⇒ Area of common area enclosed by the arcs ₌ 2 (¼ x ∏ x 16² - ½ x 16 x 16)
⇒ Area of common area enclosed by the arcs ₌ 2 x 256 (∏ / 4 - ½)
⇒ Area of common area enclosed by the arcs ₌ 512 (∏ - 2 / 4)
⇒ Area of common area enclosed by the arcs ₌ 128 (∏ - 2)
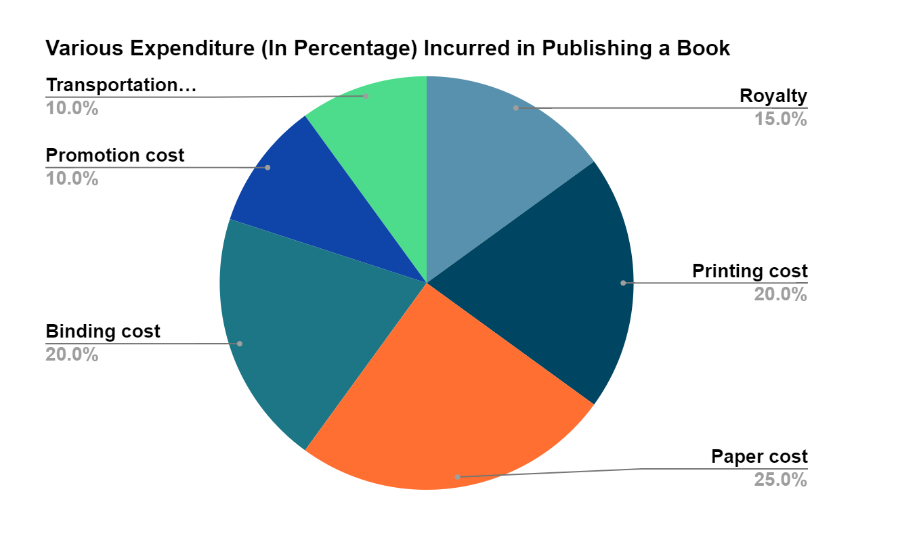
Question 3: Direction (1 - 9): Study the pie chart and answer the questions based on it.
The following pie chart shows the percentage distribution of the expenditure incurred in publishing a book.
1. What is the central angle of the sector corresponding to the expenditure incurred on royalty?
(1) 15°
(2) 24°
(3) 54°
(4) 48°
(5) None of these
Answer: (3) 54°
Explanation:
⇒ Central angle corresponding to royalty ₌ 15% of 360° ₌ 15 / 100 x 360° ₌ 54°
2. Which two expenditures together have a central angle of 108°?
(1) Binding cost and Transportation cost.
(2) Printing cost and Paper cost.
(3) Royalty and Promotion cost.
(4) Binding cost and Paper cost.
(5) None of the above.
Answer: (1) Binding cost and Transportation cost.
Explanation:
⇒ Central angle of 108° ₌ (108° / 360° x 100)
⇒ Central angle of 108° ₌ 30% of the total expenditure.
From the pie chart,
⇒ Binding cost + Transportation cost
⇒ Binding cost + Transportation cost ₌ (20 + 10)% of the total expenditure.
Hence the Binding cost and Transportation cost ₌ 30% of the total expenditure.
3. If the difference between the two expenditures are represented by 18° in the pie chart, then these expenditures possibly are
(1) binding cost and promotion cost.
(2) paper cost and royalty
(3) binding cost and printing cost.
(4) paper cost and printing cost.
(5) None of the above.
Answer: (4) paper cost and printing cost.
Explanation:
⇒ Central angle of 18° ₌ (18° / 360° x 100)% of the total expenditure.
⇒ Central angle of 18° ₌ 5% of the total expenditure.
From the pie chart,
⇒ Paper cost and - Printing cost
⇒ Paper cost - Printing cost ₌ (25 - 20)% of the total expenditure.
Hence the Paper cost and Printing cost ₌ 5% of the total expenditure.
4. If for an edition of the book, the cost of paper is Rs. 56250, then find the promotion cost for this edition.
(1) Rs. 20000
(2) Rs. 22500
(3) Rs. 25500
(4) Rs. 28125
(5) None of these.
Answer: (2) Rs. 22500.
Explanation:
Let the promotion cost for this edition be Rs. a.
Then,
⇒ 25 : 10 ₌ Rs. 56250 : a.
⇒ a ₌ Rs. (56250 x 10 / 25)
⇒ a ₌ Rs. 22500.
5. If for a certain quantity of books, the publisher has to pay Rs. 30600 as printing cost, then what will be the amount of royalty to be paid for these books?
(1) Rs. 19450
(2) Rs. 21200
(3) Rs. 22950
(4) Rs. 26150
(5) None of these.
Answer: (3) Rs. 22950.
Explanation:
Let the amount of royalty to be paid for these books be Rs. b.
Then,
⇒ 20 : 15 ₌ Rs. 30600 : b.
⇒ b ₌ Rs. (30600 x 15 / 20)
⇒ b ₌ Rs. 22950.
6. The price of the book is marked 20% above the cost of paper. If the marked price of the book is ? Rs. 180, then what is the cost of the paper used in a single copy of the book?
(1) Rs. 36
(2) Rs. 37.50
(3) Rs. 42
(4) Rs. 44.26
(5) None of the above.
Answer: (2) Rs. 37.50
Explanation:
Let the cost of paper for a single book be Rs. x.
Then,
⇒ 120 : 25 ₌ Rs. 180 : x.
⇒ x ₌ Rs. (25 x 180 / 120)
⇒ x ₌ Rs. 37.50.
7. For an edition of 12500 copies, the amount of royalty paid by the publisher is Rs. 284250. What should be the selling price of the book if the publisher desires a profit of 5%?
(1) Rs. 152.50
(2) Rs. 157.50
(3) Rs. 162.50
(4) Rs. 167.50
(5) None of these.
Answer: (2) Rs. 157.50
Explanation:
Let the selling price of this edition (of 12500 books) by Rs. y.
Then,
⇒ 15 : 105 ₌ Rs. 281250 : y.
⇒ y ₌ Rs. (105 x 281250 / 15)
⇒ y ₌ Rs. 1968750.
⇒ Hence, selling price of one book ₌ Rs. (1968750 / 12500)
Selling price of one book ₌ Rs. 157.50.
8. If 5500 copies are published and the transportation cost on them amounts to Rs. 82500, then what should be the selling price of the book, so that the publisher can earn a profit of 25%?
(1) Rs. 187.50
(2) Rs. 191.50
(3) Rs. 175
(4) Rs. 180
(5) None of these.
Answer: (1) Rs. 187.50
Explanation:
Let the selling price of 5500 books be Rs. Z.
Then,
⇒ 10 : (100 + 25) ₌ Rs. 82500 : Z.
⇒ Z ₌ Rs. (125 x 82500 / 10)
⇒ Z ₌ Rs. 1031250.
⇒ Hence, selling price of one book ₌ Rs. (1031250 / 5500)
Selling price of one book ₌ Rs. 187.50.
9. Royalty on the book in less than the printing cost by
(1) 5%
(2) 33 ⅓ %
(3) 20%
(4) 25%
(5) None of these.
Answer: (4) 25%
Explanation:
⇒ Difference between printing cost of book and royalty on books ₌ (20 - 15)% of cost price.
⇒ Difference between printing cost of book and royalty on books ₌ 5% of cost price.
Hence, the percentage difference ₌ (Difference / Printing Cost x 100)
The percentage difference ₌ (5 / 20 x 100) ₌ 25%


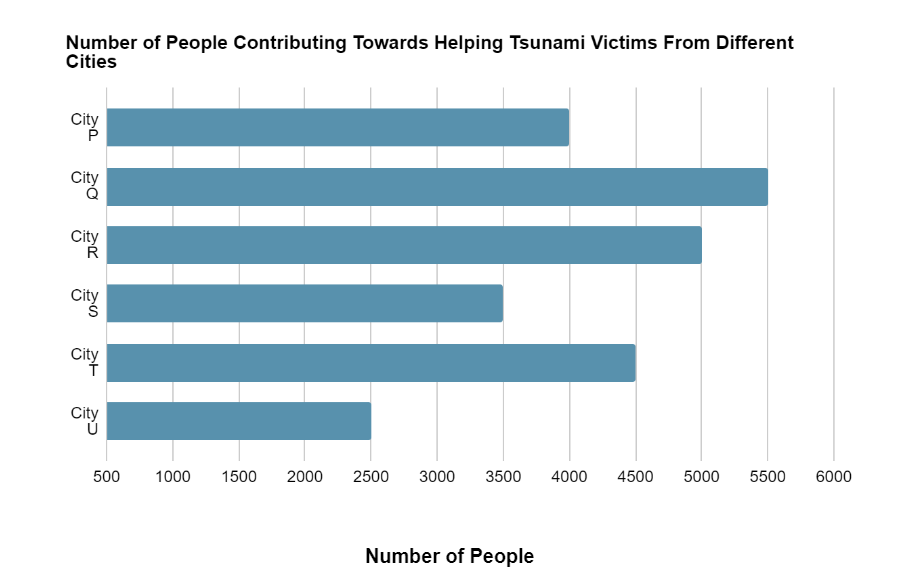
Question 4: Direction (1 - 5): Study the graph and answer the following questions.
1. How many more people from City S would have made the ratio 11 : 9 between the number of people contributing from Cities S and T, respectively?
(1) 1500
(2) 2000
(3) 5500
(4) 3500
(5) None of these.
Answer: (2) 2000
Explanation:
Let the required number of people be 𝓍.
Then,
⇒ 3500 + 𝓍 / 4500 ₌ 11 / 9
⇒ 3500 x 9 + 9𝓍 ₌ 4500 x 11
⇒ 9𝓍 ₌ 49500 - 31500
⇒ 9𝓍 ₌ 18000
⇒ 𝓍 ₌ 2000
2. Number of people contributing from Cities Q and U together form what percent of the total number of people contributing from all the given cities?
(1) 30
(2) 36
(3) 32
(4) 38
(5) None of the above.
Answer: (3) 32.
Explanation:
⇒ Number of people contributing from cities Q and U together ₌ 5500 + 2500
⇒ Number of people contributing from cities Q and U together ₌ 8000
⇒ Number of people contributing from all the cities ₌ 4000 + 5500 + 5000 + 3500 + 4500 + 2500
⇒ Number of people contributing from all the cities ₌ 25000
Therefore , the required percentage ₌ 8000 / 25000 x 100
The required percentage ₌ 32%
3. Number of people contributing from how many cities from less than 18% of the total number of people contributing from all cities together?
(1) 3
(2) 4
(3) 2
(4) 1
(5) None of these.
Answer: (1) 3.
Explanation:
⇒ 18% of 2500 ₌ 18 / 100 x 25000 ₌ 4500
Such cities are P, S, U, i.e., 3 cities
4. Approximately what percent number of people contributing from City T are more in comparison to the people contributing from City S?
(1) 38
(2) 18
(3) 22
(4) 29
(5) 34
Answer: (4) 29
Explanation:
⇒ Number of people contributing from city T =4500
⇒ Number of people contributing from city S = 3500
Therefore, the required percentage =4500 - 3500 / 3500 x 100
⇒ The required percentage ₌ 1000 / 3500 x 100
⇒ The required percentage = 28.57% =29%
5. What is the respective ratio between the number of people contributing from City P to those from City R?
(1) 5: 4
(2) 4: 7
(3) 7: 4
(4) 5: 9
(5) None of these
Answer: (5) None of these
Explanation:
The required ratio ₌ 4000: 5000 ₌ 4: 5

NLU Dream, Zero Cost Start: Free CLAT Demo
Fill your details
Frequently Asked Questions
What is the fastest way to solve Data Interpretation questions?

What type of questions are asked in data interpretation?
How can data interpretation skills be improved?
What are data interpretation skills?
How many types of data interpretation are there?

Samriddhi Pandey
Content Writer
SHARE